Prakash raj S

Data Analyst

Download CV

Intro

Hello! I'm Prakash, Passionate Data Analyst with two years of experience in Excel, Power BI, Python, MySQL

Skilled in data wrangling, dashboard creation, and data mining with a background in data extraction, analysis, and visualization. Adept at collaborating with cross-functional teams to achieve organizational goals and drive performance improvements.

Excel
Power BI
Tableau
Python
MySQL

Experience

Vee Technologies

Data Analyst

(Aug 23 – Present)

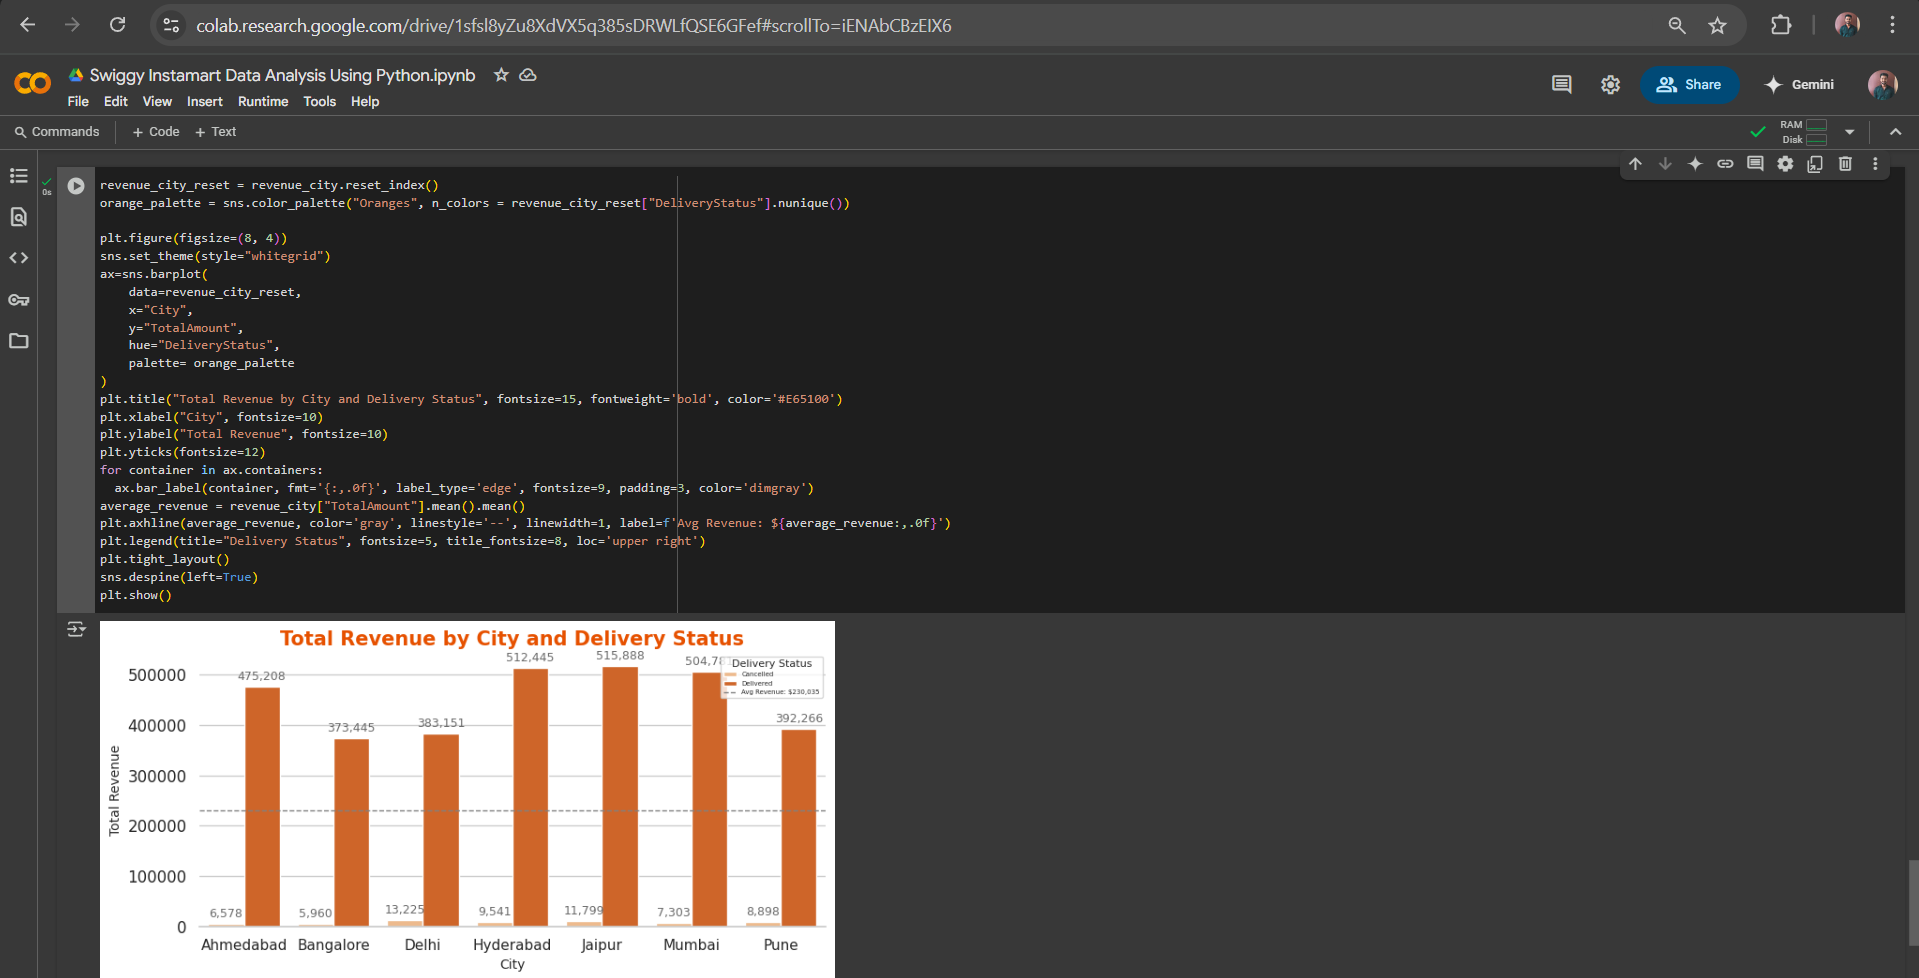
Utilized data mining techniques and web scraping to analyze large datasets and extract meaningful insights.

Created interactive dashboards and visualizations using Excel, Power BI and Tableau.

Performed manual testing on internal company tools to identify bugs, ensure functionality, and support product improvements.

Vee Technologies

Data Mining Intern

(Jan 23 – Jul 23)

Mined prospect data across multiple internal and external sources.

Extracting data from different sources like LinkedIn, ZoomInfo and other directories.

Jio

JPAM

(Aug 22 – Nov 22)

Sold products and resolved customer issues.

Maintain the product sales report and cash details in SAP & CRM.

Works

Portfolio Image
Hide

Platform Sales Dashboard

Clean & Minimalistic Dashboard

This interactive Platform Sales Dashboard provides a detailed analysis of sales and marketing performance across multiple platforms such as Google Ads, LinkedIn, Facebook, Twitter, and Instagram for the year 2024.

Project Leader: Prakash

Tool: PowerBI

Portfolio Image
Hide

Student Course Dashboard

Clean & Minimalistic Design

Developed a professional Student course details dashboard using Power BI to deliver actionable insights into course enrollments, student performance, and completion trends. The dashboard features dynamic visualizations and interactive filters, enabling users to analyze data by course, department, or student demographics.

Designed with a focus on usability and data-driven decision-making, it empowers educators and administrators to optimize academic strategies and enhance learning outcomes.

Project Leader: Prakash

Tool: PowerBI

Portfolio Image
Hide

Power BI E-Commerce Sales Dashboard

Clean & Minimalistic Design

To build an interactive and insightful dashboard that helps analyze sales performance across different regions, categories, and customer segments. The aim was to extract meaningful insights to support data-driven decision-making.

Project Leader: Prakash

Tool: PowerBI, Excel, Power Query & DAX

Portfolio Image
Hide

Swiggy Instamart Data Analysis using Python

Clean & Minimalistic Design

This project analyzes Swiggy Instamart's operations by performing data cleaning, exploratory data analysis (EDA), and visualizing key metrics through revenue bar plots, pie charts, and other insights to support data-driven decision-making.

Project Leader: Prakash

Tool:Python, Google Colab

Top